|
OUR
FEATURED RIP ® -BASED STEM INQUIRY:
(Please Note: For best results, use Internet Explorer 8 to access this page)

 
|
| |
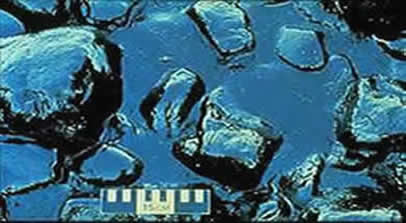
Exxon Valdez - oil pooled among rocks. (NOAA.GOV)
|
|
Teacher: Melissa Miller
Students: Seven 7th Grade Classes
Kirtland Middle School
Central Consolidated School District
Kirtland, New Mexico
2009-2010
|
|
| |
Nowadays it is common to read head-
lines about oil mishaps and how they
are destroying parts of the ecosystem.
In just the past 3 months, three report-
ed incidents involving oil wells have
"sprung up": the BP Gulf of Mexico
"gusher," a tow boat hitting an abandon-
ed oil well wellhead causing oil to spew
oil into the Gulf, and the oil pipeline
explosion spreading oil into waters off
the shore of the city of Dalian in China.
This featured inquiry demonstrates how
understanding the impact of humans on
the environment through such environ-
mental disasters as well as the tech-
nologies available to deal with them
leads students to achievement of two
of the National Science Education
Standards' "Goals of science education."
|
|
(Click here to view our kindergarten oil spill
|
|
| |
|
|
|
|
| |
Classroom and Course Demographics
- Seventh grade students at Kirtland Middle School are required
to take a full year of science. Each day I teach seven science classes, two of which are considered advanced classes. At
the time of this RIP® (Research Investigation Process) scientific
inquiry, I had a total of 133 students. Thirteen percent of
these students I involved are considered Special Education,
10% are ELL, and 77% general education. Kirtland Middle
School is a Title 1 school.
- The science course involves studying the scientific method,
forms of matter and energy, cells, genetics, ecology,
classification, plants, the human body, and Earth in the
solar system.
- The course is designed to build on knowledge that the students
gained from the sixth grade, as well to develop new knowledge
of new concepts. Some of the tasks involved in this course
include doing research, presentations, hands-on labs, and
many individual and group activities.
- The classroom environment I have established is geared
toward students feeling safe, involved, engaged, being
respectful towards one another, and gaining an
appreciation and respect for science.
I am a new teacher and this is the first year that I had
scientific inquiry as an instructional tool in my classroom.
The Research Investigation Process (RIP) was implemented
|
|
at selected schools and classrooms in my school district
beginning around the middle of the 2009-2010 school year.
I attended a six-day training session with other secondary
teachers prior to introducing this scientific inquiry-based
critical thinking model to my students. At the time that this
inquiry was started by my students, I had already
introduced the RIP into the classroom and my students
had conducted one previous inquiry over the course of
the year.
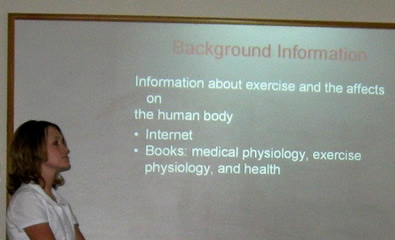
Ms. Miller presents to her colleagues a storyboard proposal (one of the
features of the RIP scientific inquiry model) for another inquiry that she
developed during a RIP training session.
|
|
|
INSTRUCTIONAL PLAN AND OBJECTIVES |
| |
Introducing the Oil Spill Inquiry
When coming up with this inquiry, my initial thought
was to come up with something that dealt with the
environment (Ecology). Then I remembered that many
of my students really seemed to be intrigued with oceans
and ocean life, so I wanted to incorporate oceans
somehow into my next inquiry with the students. The
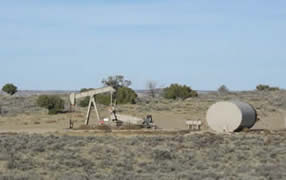
oil industry is prevalent in New Mexico and oil well drilling
is a common sight for those of us here even if we may
not have some immediate family member or relative
working the oil fields in some capacity.
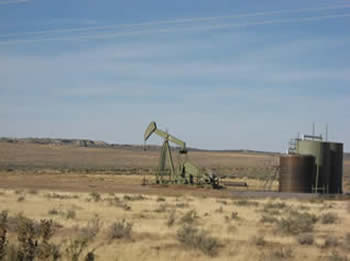
An oil drill rig in New Mexico.
So I thought that simulating an oil spill and having the
students decide which methods of clean up to use and
test would be relevant and fun, yet a very valuable
learning experience that dealt with oceans and ocean
life. However, sadly, I had no idea that, after coming
up with the storyboard proposal and preparing to
introduce this guided inquiry to my classes, the BP oil
geyser in the Gulf would happen.
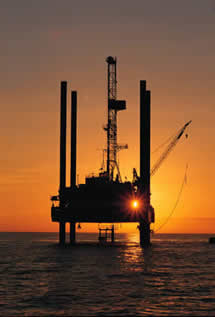
Offshore oil drill rig.

Although we were geographically far from the Gulf
disaster site, the media coverage was abundant and
we felt as if we were first hand witnesses. It is not
difficult to imagine the value of this developing tragedy
for motivating my students to learn about ecology
and man's influence on the environment through
the use of models. It was indeed a teachable moment!
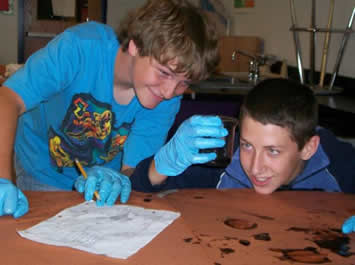
As I was relatively new to teaching through scientific
inquiry and had not previously attempted this guided
inquiry on oil spills, I decided to explore some of my
ideas with my own children at home before
attempting to introduce it into my classes at school.
|
|
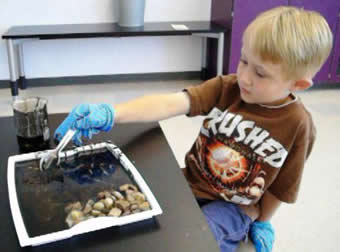
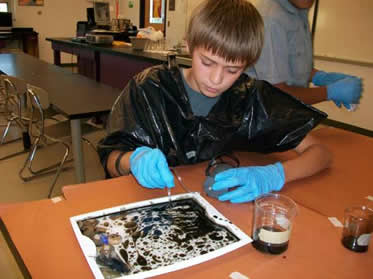
Melissa Miller's son skimming oil off of the surface of water in
a simulated oil spill.
CLICK HERE TO SEE VIDEO:
Ms. Miller practices her Socratic questioning and formative
assessment skills as she questions her son, Carson, about what he is
doing and why as he uses a skimming technique to collect oil from the
surface of the water in a simulated oil spill.
Scientific Inquiry Instructional Goals & Objectives
I developed the plan for engaging my students in this
research investigation with the expectation that the
outcomes would align with Goals I and III of the
National Science Education Standards (NSES).
NSES Goal I: Experience the richness and excite-
ment of knowing about and understanding the
natural world
I expected this inquiry-based instructional approach to
stimulate student interest to learn about science because
- I was providing students with the opportunity
to answer their own questions.
- Students were provided the opportunity to design
an investigation to test their own hypotheses
about the natural world.
NSES Goal III: Engage intelligently in public discourse
and debate about matters of scientific and
technological concern
By the end of this unit, I expected my students to be
able to:
- understand what ecosystems are and why they
are important.
- describe and provide examples of the inter-
dependence of organisms in an ecosystem.
- explain how an oil spill affects the environment.
- identify different methods used to clean up
oil spills.
- understand the mechanisms through which
these methods work by having them put their
cleaning methods to use to clean up a
simulated oil spill.
Specifically, my students would:
- Observe a short movie clip of the Exxon Valdez
Oil Spill.
- Record their observations and assess them
for objectivity.
- Ask questions concerning oil spills.
- Formulate and pose a research question originating
from one or more of their objective observations.
- Gather background information related to their
research question.
- Construct a testable hypothesis.
- Design a study to test their hypothesis.
- Record data and analyze data accurately.
and honestly.
- Use evidence based on their data to support their
decision about their hypothesis.
- Evaluate and discuss findings within their groups.
- Come together as a class and discuss their findings,
as well as their understandings of oil spills, and relate
them to the Gulf Oil Spill that is happening now.
|
|
MATERIALS USED
|
| |
BACKGROUND MATERIALS
- A video about oil spills and their consequences to the
environment
- Exxon Valdez Oil Spill 1989:
http://www.youtube.com/watch?v=
YkzB1ZYcTwM&feature=related
http://www.youtube.com/watch?v=
NuVv6jDk1jY&feature=related
- The Exxon Valdez Disaster-20 Years Later:
http://www.youtube.com/watch?v=
MbjC9SMKClE&feature=related
- Alaska's Big Spill -National Geographic
- World Wide Web Resources containing pictures of the
consequences of the Exxon Valdez oil spill: http://response.restoration.noaa.gov/gallery_gallery.php?
RECORD_KEY%28gallery_index%29=joinphotogal_id,
gallery_id,photo_id&joinphotogal_id(gallery_index)=171&
gallery_id(gallery_index)=12&photo_id(gallery_index)
=106]
- Books and other Internet sites containing conceptual
information about ecosystems
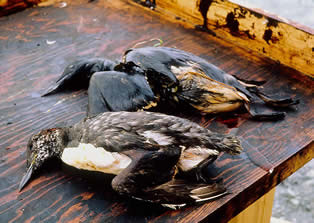
Birds killed as a result of oil from the Exxon Valdez spill.
(Photo courtesy of the Exxon Valdez Oil Spill Trustee Council.)
|
|
- A slide show about many different traditional and
nontraditional methods for cleaning up oil spills
- http://classic.cnbc.com/id/37593652?slide=1
The Research Investigation Process (RIP) is a critical
thinking model based on how scientists think when
conducting their research about the natural world.
I have a RIP flowchart (see below) on my classroom
wall to which my students can refer when engaging in
their scientific inquiries.
Flowchart of the RIP for secondary students.
(Click on chart to enlarge)
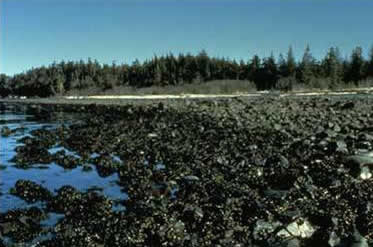
Exxon Valez oil onshore at Herring Bay (NOAA.GOV) .
|
|
| INTRODUCTION |
| |
Providing My Students with the Opportunity
to Make Observations
The first step for me as to stimulate student interest as I
introduced our topic. This was done by having my
students watch a short video clip regarding the Exxon
Valdez Oil Spill that happened in 1989. The video
focused on consequences of the oil spill to the sea
environment. From there, I had them individually write
down their observations from the video clip. My students
had previously learned how to make and identify
objective observations.
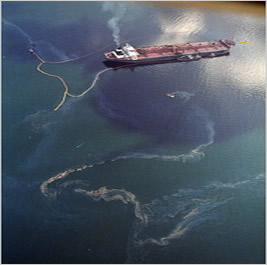
Exxon Valdez - grounded on Bligh Reef.
Then as a class, we all shared what we observed; these
observations were written down on chart paper at the
front of the classroom for everyone to see. Many
students were surprised at the damage that was done
by the oil spill resulting from the ship hitting Bligh Reef.
Student Observations
- An oil tanker was leaking oil.
- The people couldn’t contain it.
- The oil spread all over.
- Animals were coated in oil.
- Many animals died.
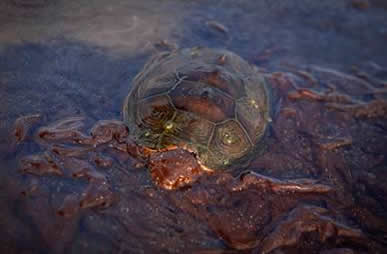
A sea turtle on Grand Terre Island, June 8, 2010.
(Reuters/Lee Celano) [Source: http://news.yahoo.com/s/ynews/ynews_sc2694;
_ylt= Alm89rTMrl0_Kj1th6Y.b.vZa7gF;_ylu=X3oDMTB2djk2ZDM1BHBvcw
M3BHNlYwN5bl9mZWF0dXJlZARzbGsDaW1hZ2U]
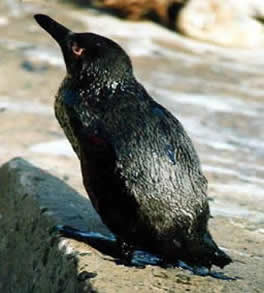
An oil-coated bird.
- The oil tanker lost 11 million gallons of oil.
- The oil spill happened in 1989.
- It took 12 hours for clean up efforts to arrive.
- After many years oil still remains there.
- The spill happened in Alaska
- Oil can kill ecosystems.
- Oil spills affect the food chain.
- The oil wasn’t easy to clean up
Socratic Questioning
I knew that I wanted to get my students to "buy into"
this topic as early as possible so that they would take
ownership and contribute to the thinking involved in all
aspects of this research investigation. I began by
questioning them, focusing on detailed aspects of
sources for oil spills, consequences on the ecosystem,
and methods for cleaning up oil spills.
The Questions I asked included:
What is an oil spill?
Are oil tankers the only source of oil spills?
Where do most oil spills happen in the world?
Do oil spills affect the wildlife in and around the ocean?
Can oil spills be cleaned up?
Is it an easy process to clean up oil spills?
What can be used to clean up an oil spill?
Does the type of oil involved in the spill affect the
clean-up process?
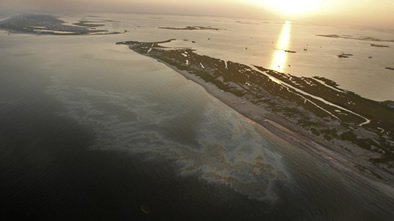
Oil from the Deepwater Horizon oil spill is seen at sunset off East Grand
Terre Island, where the Gulf of Mexico meets Barataria Bay, on the
Louisiana coast on July 31. Top left is Grand Isle.
(Gerald Herbert/Associated Press) [Source: http://www.cbc.ca/world/story/
2010/08/02/ gulf-oil-spill-cap.html?ref=rss# ixzz0vTp47CA7]
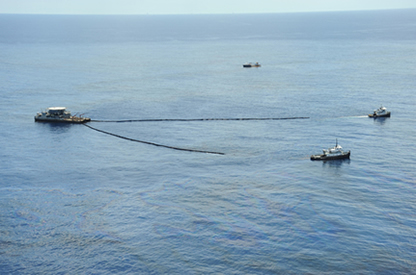
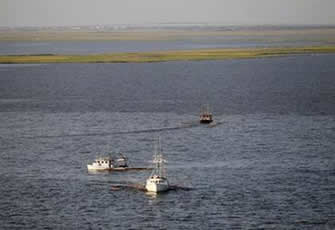
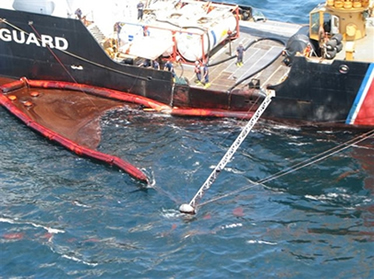
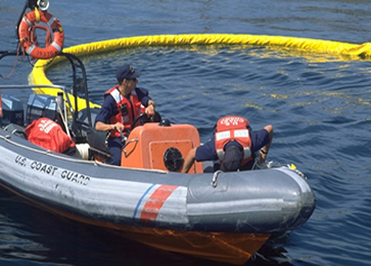
GULF OF MEXICO - Skimming operations continue to help mitigate the
effects of the BP Deepwater Horizon oil spill Friday, June 25, 2010.
( U.S. Coast Guard photo by Petty Officer 3rd Class Jaclyn Young.)
CLICK HERE TO SEE OIL SPILL SKIMMING VIDEO:
Gulf of Mexico - U.S. Naval Skimming Operations (Vessels conduct
skimming operations in the Gulf of Mexico near the site of the
Deepwater Horizon incident May 22, 2010. The Deepwater Horizon,
a mobile offshore drilling unit, exploded April 20, 2010 and sank two
days later.) [Used with permission, U.S. Coast Guard ]
Many student questions arose as a result of the
discussion of their observations, and my questioning.
Their observations included some of the methods for cleaning
up the surface of water following a spill.
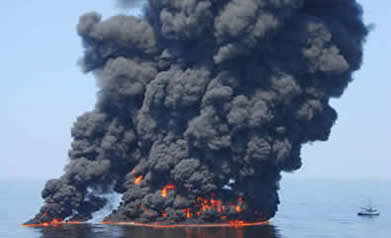
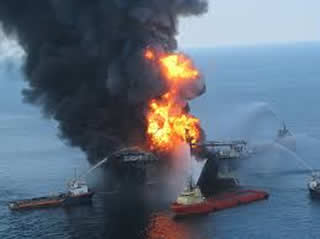
A controlled burn of oil from the Deepwater Horizon/BP oil spill sends
towers of fire hundreds of feet into the air over the Gulf of Mexico June 9.
(Courtesy: U.S. Coast Guard, Photo by Petty Officer First Class John Masson)
CLICK HERE TO SEE OIL BURNING VIDEO:
In-situ burn footage shot by Petty Officer Justin Sawyer, April 28, 2010,
Deepwater Horizon Response, Gulf of Mexico
(Used with permission, U.S. Coast Guard)
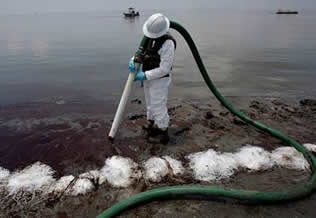
A hose sucks oil from the shoreline June 9 in Belle Terre, La.
(AP Photo/Eric Gay) [Source: http://news.yahoo.com/s/ynews/ynews
_sc2694;_ ylt=Alm89rTMrl0_Kj1th6Y.b.vZa7gF;_ylu=X3oDMTB2
djk2ZDM1BHBvcwM3BHNlYwN5bl9mZWF0dXJlZARzbGsDaW1hZ2U]
|
|
Student interest in clean-up ability really peaked as news of
the BP-Deepwater Horizon oil spill began to surface. In the
end, a research question was established that would in time
be answered through the use of an investigation.
Deepwater Horizon Fire (Courtesy: United States Coast Guard).
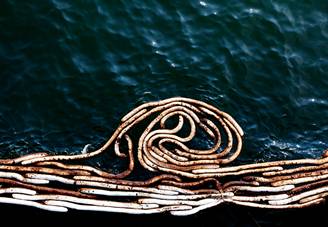
Based on the background information they had collected,
they focused on two methods for cleaning the oil off of
the surface of the water: absorbing and skimming.
Oil skimmers are seen working in oil.
[Source: http://news.yahoo.com/s/ynews/ynews_sc2694;_ylt=Alm89rT
Mrl0_Kj1th6Y.b.vZa7gF;_ylu=X3oDMTB2djk2ZDM1BHBvcwM3BH
NlYwN5bl9mZWF0dXJlZARzbGsDaW1hZ2U]
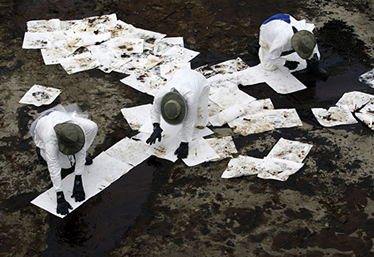
Absorbent pads are applied to soak up oil that has washed ashore June 6.
in Grand Isle. (AP Photo/Eric Gay) [Source: http://news.yahoo.com/s/ynews
/ynews_sc2694;_ylt=Alm89rTMrl0_Kj1th6Y.b.vZa7gF;_ylu=X3oDMTB2djk2ZD
M1BHBvcwM3BHNlYwN5bl9mZWF0dXJlZARzbGsDaW1hZ2U
Research Question
When cleaning up an oil spill, which method, skimming or
absorbing, is most effective for removing the oil?
Background Information
Days 2 and 3 of this inquiry were spent in the computer lab
where the students did background research in regard to oil
spills and cleaning methods. On the following day, we came
together as a class and discussed our research findings.
Their background research covered three topics:
- What an oil spill is
- How oil spills affect the ecosystem
- The different ways oil spills can be cleaned up
Below is some of the information they gathered and
learned about:
- The nature of oil spills
- An oil spill is the discharge of oil that reaches
bodies of water.
- The wind speed and the density of the oil
determines how fast oil spreads.
- Oil spills happen due to many reasons.
- Oil tankers can leak it out.
- People purposely dump oil into
bodies of water.
- Natural disasters can cause them.
- Oil spills affect the environment in many ways:
- Animals die due to the ingestion of oil
(cleaning themselves).
- Animals die of hypothermia.
- Shorelines are destroyed.
- Animals suffocate (blow holes get blocked
with oil).
- Methods used for oil clean up include:
- Burning-used to clean oil up off the water
through the use of controlled burns. Oil
is collected into dense pools that are
then remotely ignited. This method can
negatively impact air quality.
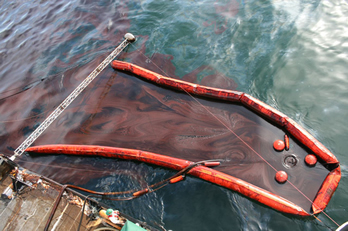
- Skimming-booms are used to contain and
gather the oil into dense pools and then
skimmers or centrifuges are used to
separate the oil from the water.
- Evaporating-according to experts, dispersed
oil that does not get collected from
skimming, absorption, or burning
eventually evaporates.
[Experts: Most of the Gulf Oil Spill Won't
Be Cleaned Up, April 29, 2010; http://
www.livescience.com/environment/gulf-
oil-spill-clean-up 100429.html]
- Absorbing-soaking the oil up into absorbent
material. My students learned from the
background information that absorbing is
the most commonly used method for cleaning
up an oil spill. The three types of sorbent
materials that can be used:
- natural inorganic (e.g., sand)
- natural organic (e.g., saw dust,
feathers, cotton)
- synthetic (plastic-like material)
To be useful in combating oil spills,
sorbents need to be both oleophilic
(oil-attracting) and hydrophobic (water-
repellent). Cotton is considered to be
both (http://cottontoday. cottoninc.
com/sustainability-future/Cottons-Role-in-
Gulf-Clean-up/).
- Dispersants-when a dispersant is applied to
an oil spill, it pulls apart oil particles
suspended in the water. These
chemicals break up the oil, allowing for
easier absorption and natural
biodegradation including evaporation.
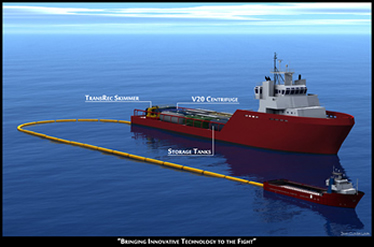
"Bringing innovative technology to the fight."
New Orleans – 278-foot skimmer, a macerator 6000 barrel capacity
U.S. vessel outfitted with a centrifuge. The skimmer extracts and
filters oil through a cage to avoid bringing in debris. The oil is then
sent to the Macerator, which is a device designed to chop up any
debris collected during oil recovery. The oil is then sent to the
centrifuge, made popular by actor Kevin Costner, which spins the
mixture so that the oil and water is separated. The oil is then finally
sent to the vessel's storage tanks. Graphic created by Deepwater
Horizon Response. (Owner: SA Grace Baldwin) [Courtesy: U.S.
Coast Guard]
CLICK HERE TO SEE OIL SPILL BURNING AND SKIMMING VIDEO:
Offshore Offensive. (The U.S. Navy and Coast Guard battle the
Gulf oil spill using burning and skimming procedures.)
[Used with permission, U.S. Coast Guard ]
Hypothesis
On this day, I had the students separate into their specified
groups. For each of my classes, I had the students divided
up into five groups. Here they began their construction of a
hypothesis on chart paper. I had each group present their
hypothesis that they constructed to the entire class. As a
class, each hypothesis was critiqued, and from there, it was
decided which hypothesis we would go with:
"If an oil spill is simulated and we compare the methods
of skimming and absorbing to clean up the oil, then we
will find that absorbing is a more effective method
because absorbing soaks up the oil and this is the most
common method used in the history of oil spill clean-ups.”
Having the students do this in front of the class works
really well. It allows the students to see what they forgot or
didn’t need and allows other groups to be aware of and
recognize what they need to fix.
|
|
| DESIGNING THE STUDY: METHOD |
| |
Together as a class, we began designing the Research
Investigation Process study that would be used to test their
hypothesis on the eighth day. Here the students identified
the subjects and the materials that would be used to
conduct the study. These items were written on the
board at the front of the classroom.
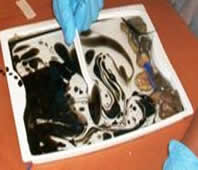
Subjects
The subjects in this study were simulated (model) oil spills.
Each class conducted their own oil spill investigation and
had five groups of students. Each group had their own oil
spill model.
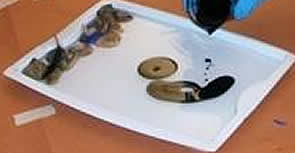
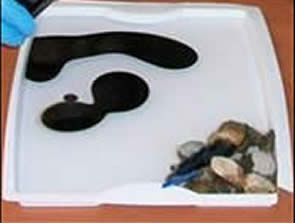
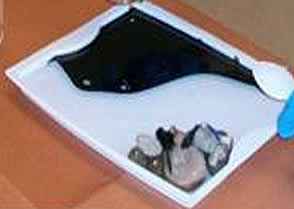
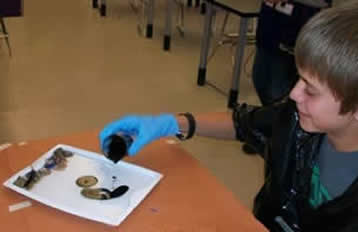
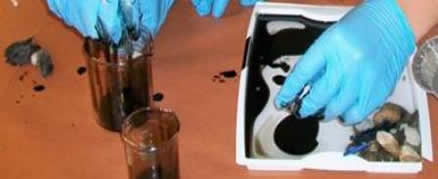
Student-made oil spill models. [Each model contained
a shoreline with rocks and feathers (to simulate
effects of the oil and clean-up method on wildlife).]
Study Materials and Equipment
- Chart paper for recording class observations
- Water
- Used motor oil
- Beakers for collecting, measuring, and pouring water
and oil
- Plastic trays to contain the ocean-oil spill simulation
- Cotton balls to absorb oil from the surface of the water
- Spoons to skim oil from the surface of the water
- Gloves for safety and protection
- Bucket for oil disposal
- Rocks to compose a shoreline
- Feathers to assess impact of spill on wildlife
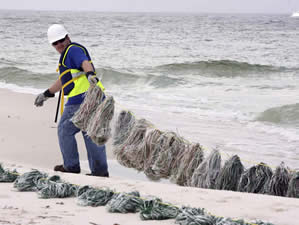
A worker installs "pom poms" to soak up oil at the
Pensacola inlet Sunday, June 6, 2010, in Pensacola
Beach, Fla. (AP Photo/Orlando Sentinel, George Skene)
|
|
Study Materials and Equipment (continued)
the amount of oil collected using each of the clean-up
methods and documenting qualitative data in the form of photographs
- Bar graphs to enter data and statistics for determining
whether the students' hypotheses were supported
or not
Developing the Procedure for the Study
The students separated into their groups and began
developing their procedures onto chart paper. After all the
groups were finished with this, I had each group bring up to
the front of the classroom their chart paper with their procedure
written on it to present it to the class. Here each procedure
was critiqued, and a class procedure was established taking
the best ideas from the groups' proposed procedures. Again,
having the students present this in front of the class was a
great way for the students to recognize what was missing
or wasn't necessarily needed.It also helped students with
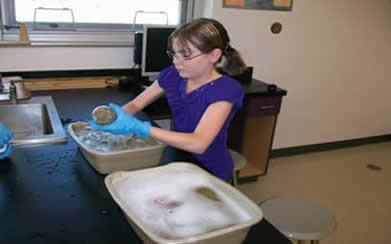
speaking in front of an audience.
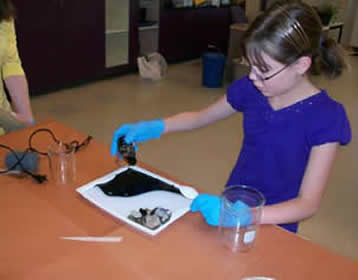
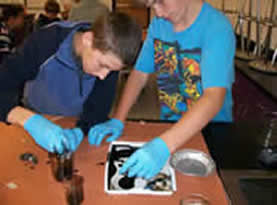
Students carefully pour used motor oil from the beaker into their
simulated ocean water.
Drilling for oil in New Mexico.
|
|
| |
The Procedure
|
|
| |
1. The materials were obtained in quantities that would
permit 5 groups of students in each of my classes to
make their own oil spill model.
2. Students built a shoreline made of rocks and a few
feathers inside towards one end of the plastic model
tray. This would be useful for assessing the impact of the
oil spill and clean-up efforts on shoreline ecology including
the substrate and wildlife.
3. The ocean portion of the models was formed by measuring
300 ml of water in a beaker and pouring the water into
the tray.
4. A photograph was then taken of each model to document
the condition of the simulated ocean and shoreline prior to
the oil spill occurring. This photograph was entered as
qualitative data into Table 2 for each group.
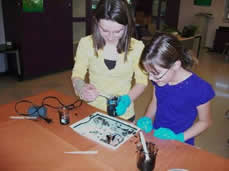
5. While wearing gloves, the students measured 50 ml of oil
in a beaker.
6. The oil was then poured into the tray with water and
allowed to sit for 3 minutes.
7. Waves were then created in each oil spill model using an
aquarium air pump connected to an air tube turned on for
3 minutes.
8. Using the spoon, students skimmed the oil off the surface
of the ocean for 7 minutes. The collected oil was placed
into a beaker.
9. The amount of oil collected (in ml) was then recorded onto
a separate data table (Table 1) for each group. These data
represented the quantitative (number) data for this study.
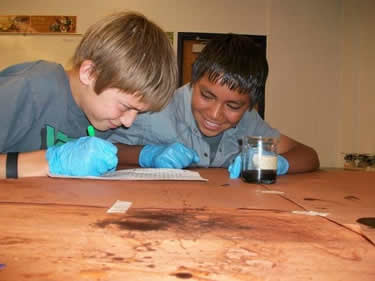
10. Students then made observations of the ocean and
shoreline to see the impact of the oil, if any.
11. The students then took a picture of their simulated
oil spill following the cleanup procedure.
12. These qualitative (picture) data were then entered onto
Table 2 for each group.
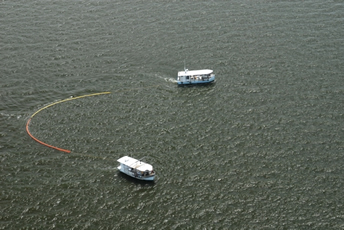
Two vessels skimming oil off of the water surface in the
Gulf of Mexico. (Courtesy United States Coast Guard)
|
|
13. The water and oil from the oil spill models were
discarded into the disposal bucket and the rocks and
tray were thoroughly washed.
14. Each group repeated steps 2-13 for the skimming
method two more times so that they would have data
to summarize as medians for the three replicates.
15. Following the completion of the skimming method, the
students began the procedure for the absorbing
method of cleaning the oil up from the oil spill.
16. The identical simulated shoreline was built with the
rocks and feathers and 300 ml of "ocean" water
added to the plastic trays to again produce the
oil spill model. The model ocean was photographed.
17. 50 ml of oil were added to the plastic trays in the
same manner as before to again produce the oil spill.
18. This time, the students used the cotton balls to absorb
oil from the surface of the water.
19. When the cotton ball was saturated, the students
squeezed out the collected oil from the cotton into
a beaker.
20. After 7 minutes of oil collection using the absorbing
method, the amount of oil collected (in ml) were
recorded onto Table 1 for each group.
21. Waves were then created in each oil spill model using
the aquarium air pump in the same way as before.
22. Students then made their observations of the ocean
and shoreline to see the impact of the oil, if any.
23. Each oil spill model was photographed for qualitative
data and the photographs added to Table 2.
24. Steps 16-23 were repeated two more times by each
group of students for the absorbing method.
25. After all the students completed their absorbing
procedure, everything was cleaned up and the oil
prepared for proper disposal.
Coast Guard cutter Aspen skimming oil in Gulf. (Courtesy United
States Coast Guard)
|
|
| |
CONDUCTING THE STUDY TO TEST OUR HYPOTHESIS |
|
| |
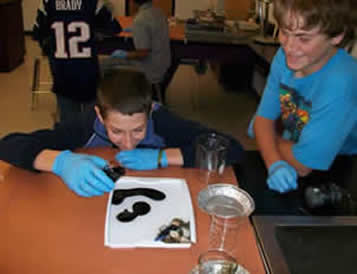
Student using the air pump to make simulated wave action in the oil spill model.
|
|
| |
| |
Collection of oil using the skimming method (left) and placing the collected oil
into the beaker (right).
U.S. Coast Guard cutter Aspen skimming oil off of the surface of the
Gulf waters. (Courtesy U.S. Coast Guard)
The students began the actual procedure part of their
inquiry on the twelfth day. Each method was tested
three times; that is why the actual conducting of the
study continued on for six days. During the first three
days they tested the skimming method, and during the
last three days they tested the absorbing method.
After each testing trial, the students recorded their
quantitative (#) data onto Table 1.
Students recording the collected oil data from the beaker.
They also recorded their qualitative (picture) data. They
took a before picture of the water before the oil was
dumped in and record the picture into Table 2. They
also took one picture after each cleaning method was
complete and recorded those pictures into Table 2
as well. So, all together, they had three pictures:
one before and two after pictures (one following
skimming & one following absorbing the oil from
the surface of the "ocean").
United States Coast Guard skimming oil in the Gulf.
(Courtesy U.S. Coast Guard)
|
|
Close-up of absorbing the oil with cotton balls and squeezing it out into a
beaker for measurement.
Students using cotton balls to collect the oil
through absorption.
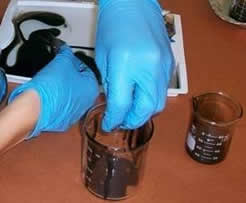
Squeezing absorbed oil from the cotton balls
into a beaker.
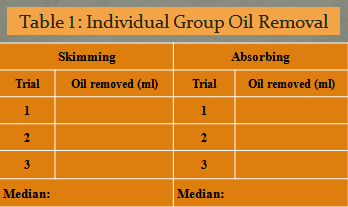
Structure of data table used by each group of students for writing
down the amount oil collected for each of the three trials using the
two methods.
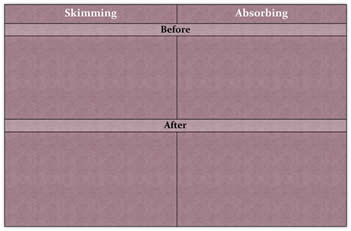
Structure of Table 2 for descriptive (qualitative data)
Absorbent material collects oil near the base of a Gulf Shores
fishing pier June 14. (Chris Graythen/Getty Images)[Source: http://news.yahoo.com/s/ynews/
ynews_sc2694ylt=Alm89rTMrl0_Kj1th6Y.b.vZa7gF;_ylu=X3o DMTB
2djk2ZDM1BHBvcwM3BHNlYwN5bl9mZWF0dXJlZARzbGsDaW1hZ2U] |
|
| |
THE RESULTS |
|
The two methods had been tested, and now it was time
for the students to analyze their data. Each group needed
to come up with the median amount of oil collected for
each of their methods (skimming and absorbing) and
record them into their Table 1.
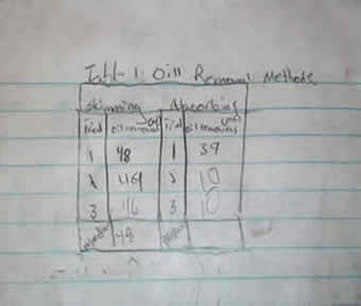
One group's data table used for writing down the amount oil
collected for each of the three trials using the two methods.
The median amounts of oil collected for skimming and
absorbing over three trials are shown on the bottom row.
Then together as a class, the students came up with a
class data table (Table 3, see below). In this particular
table, each group’s median amount of oil collected for
each method was recorded and a class mean then
calculated for each method.
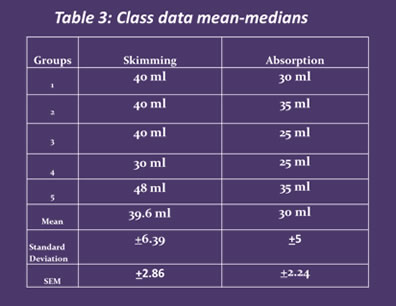
Table 3 displays the data my 5th hour class. Skimming and absorption
medians were entered for each of the five groups and then means and
error [standard deviation and standard error of the mean (SEM)] calculated.
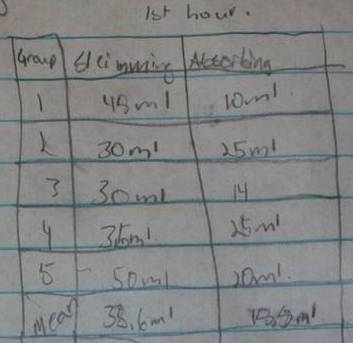
This is one student's handwritten Table 3 from my first hour class.
After table 3 was completed, a graph was constructed.
Then the standard deviation and standard error of the mean
were calculated and placed on the graph so that students
could show the error that occurred in their data and use
this error measurement (standard error of the mean or
SEM) to make their decision about their hypothesis.
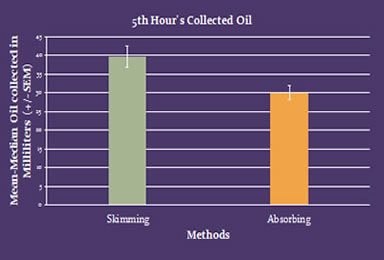
Figure 1 containing the mean-median quantity of oil collected by students
in my fifth hour class using the absorbing and skimming methods.
[Note that the standard error bars for the two means do not overlap.]
The students in all but my 6th hour class found that their graphs of mean-medians with standard error bars showed a statistically significant difference in the amount of oil they were able to collect using the two different methods of collection—absorbing and skimming. In all cases, they were able to collect more of the oil off of the water using the skimming method than the absorbing method [see the graph above (Figure 1, above) for my 5th hour class's data].
|
|
Below is the graph for Figure 1 for my 6th Hour students. As
you can see, the error bars on the mean amount of oil
collected for the two methods overlap. This indicates that the
apparent difference in the means can be explained by error
in the study and therefore, statistically speaking, there was
no difference between the mean amount of oil collected
for the two methods.
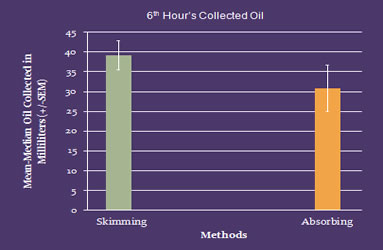
Figure 1 containing the mean-median quantity of oil collected by students
in my sixth hour class using the absorbing and skimming methods.
[Note that the standard error bars for the two means overlap.]
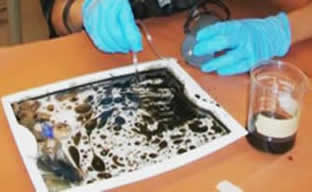
The pictures that the students took after collection of the oil
following the simulated spill, agreed with their quantitative
data analysis. They could see clearly that the water that
had been skimmed to remove oil was much clearer than the
water that had been cleaned with the absorbing method
(see Table 2 below).
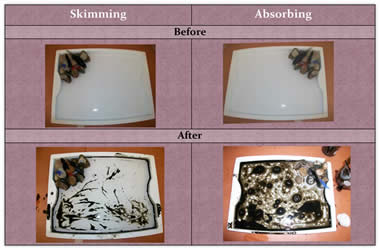
Table 2 for one group of students containing the photographs before the oil
spill and after clean up efforts using skimming (left) and absorbing (right).
But why were the data for the 6th hour class different than
those obtained by the other six classes? By looking at the class
data tables (Table 3, see directly below) containing the data from
each group, my students could identify the reason that the mean-medians for the 2 collection methods for the 6th hour class
overlapped when error was considered. One group, Group 2,
had collected a large amount of oil when using the absorbing
method compared to using the skimming method. This added to
the error or variability and resulted in the overlap between the
means when error was considered.
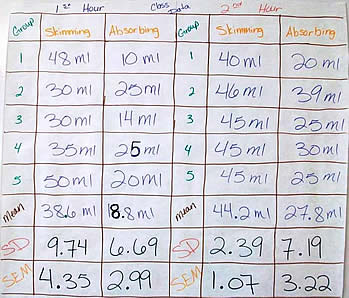
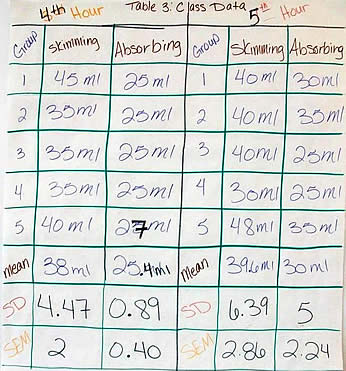
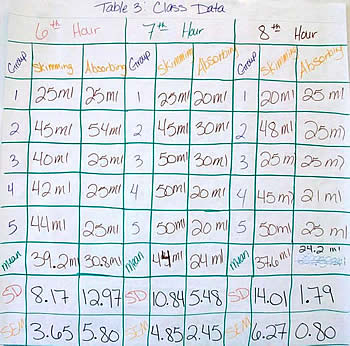
The Table 3 data from all seven of my classes. Note that when the
standard error (SEM) was taken into account, the skimming method
resulted in significantly higher amounts of oil being collected by
my students for all but my 6th hour class.
|
|
|
|
Washing the glassware to remove the oil at the completion of the study. |
As part of their inquiry experience, my students were
expected to exhibit the behaviors of responsible scientists
for safety and laboratory maintenance. After the investigation
was completed, the students pitched in to clean up laboratory
benches, desks, and all equipment and tools used.
|
DISCUSSION AND CONCLUSION
|
| |
Now that all the data had been recorded and analyzed, it
was time to discuss the results and make some conclusions.
All but one class had the same outcome: skimming appeared to
be the more effective method in removing the oil.
Their hypothesis was, "If an oil spill is simulated and we
compare the methods of skimming and absorbing to
clean up the oil, then we will find that absorbing is a
more effective method because absorbing soaks up the
oil and this is the most common method used in the
history of oil spill clean-ups.”
Because their findings showed that more oil was collected
and the water appeared clearer following skimming, they
decided that the data did not support their hypothesis.
Their successful completion of their research investigation
had enabled them to answer their research question,
"When cleaning up an oil spill, which method, skimming
or absorbing, is most effective for removing the oil?"
Skimming was the most effective means for cleaning up
the oil from the water in their simulated oil spills.
Some of the students were really surprised at the results
of their investigation—they truly believed that absorbing
would collect more oil. But that wasn’t the case in their
research investigation.
One of the possible reasons they discussed for their findings
that did not support their hypothesis was that the absorption method for collecting the oil resulted in too much water being
collected along with the oil. As was mentioned earlier in the background information section, the structure of natural
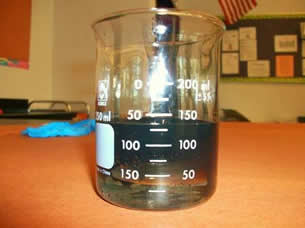
Close-up of oil collected from skimming method.
As you can see from the picture there was quite a bit of water
that was collected with the oil. The water and oil separated
from each other leaving the oil sitting on top of the water.
cotton makes it hydrophobic (repels water) and oleophilic
(attracts oil). However, we used processed cotton balls in
our investigation and these structural characteristics found
in natural cotton have likely been altered.
Another possibility they discussed was that that since the oil
floated on the surface of the water, it may have been easier to
collect using the skimming method.
|
|
The students were also able to see how sample size and
differences in data among the samples can impact whether
or not a scientist will find a difference in the data collected
in an investigation. One out of 5 medians was relatively high
for the absorbing data for the 6th hour class and the mean
and error were influenced by this data point.
This discussion also easily leads to a review of when to apply
the mean and median as the measurement of the center of a
group of data. The mean-median data typically provide the
smoothest data in science. However, the class mean-median
for a small sample size (5 groups) can still be impacted by an
outlier as was seen for the 6th hour class.
My students discussed what they had learned about how
difficult it was to collect oil from water, especially after it
was mixed together with the simulated waves and currents
produced from the air pump. They had learned about and
were able to discuss and debate in a responsible and
knowledgeable way the different technologies and methods
available for collecting and eliminating oil from the
environment. It was easy for this discussion to relate
directly to what they had learned about the Exxon Valdez
and Deepwater Horizon/BP oil spills and how difficult it is
to clean up the environment following these calamities.
In addition to the process of using scientific inquiry as an
investigation tool, student discussion and conclusions about
their data also included content they had learned previously
in my class and through this inquiry about ecology, man's
impact on the environment, and environmental stewardship.
The students also discussed improvements they would make to
their procedures. In their procedure, the students collected their
data following only about 10 minutes after they had placed the
oil (mixed with water) in the beaker. While they conducted their investigation, a number of students had observed that the oil
continued to separate out over time. Thus, not all of the oil
collected was being included in the data and the period of
wait-time before measuring the amount of oil was very important
or the accuracy of the study! The students decided that they
needed to allow the beaker of collected oil to sit for 24 hours
before measuring the amount of oil in the beaker. The reason
for this is the oil needs some time to separate from the water.
While collecting oil, there will always be some amount of water
collected with it; to ensure a more accurate measurement,
the collected oil needs to sit for longer than about ten
minutes, which is the amount of time that my students had.
Also, coloring the water blue with food coloring to try and
resemble the ocean produces a blue tint and made it hard to
decipher where the water and oil are exactly separated from
each other in the beaker. Just plain clear water works the best.
|
|
THE NEXT STEP
|
| |
After my students had fully completed the investigation with their discussions and conclusions, they planned what they would do next. The following were the different possibilities that arose.
Replication of the study with improvements:
- Improving the methods by using natural cotton in place of the processed cotton balls.
- Improving the procedure by increasing the amount of time to let the oil and water separate before measuring the amount of oil collected.
- Reduce the influence of error by increasing the sample size by having more groups of students within each class, or by pulling the data from all of the groups in all of the classes and then analyzing it.
|
|
Conduct a further investigation:
- Compare natural to processed cotton to see whether natural, unprocessed cotton will work better than the cotton balls to absorb oil.
Gather more background information: about the causes of
oil spills, the environmental damage they can cause, and
clean-up and prevention methods.
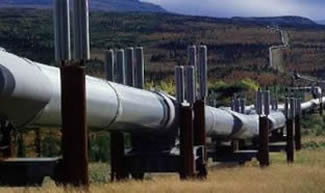
An oil pipeline (Sudan Tribune-Kenya). |
|
NATIONAL SCIENCE EDUCATION STANDARDS ADDRESSED
|
| |
- Science
as Inquiry
CONTENT STANDARD A:
As a result of activities in grades 5-8,
all students should develop
- Abilities necessary to do scientific inquiry
- Understanding about scientific inquiry
- Life Science
CONTENT STANDARD C:
As a result of activities in grades 5-8,
all students should develop understanding of
- Populations and ecosystems
|
|
- Science and Technology
CONTENT STANDARD E:
As a result of activities in grades
5-8, all students should develop
- Abilities of technological design
- Understanding about science and technology
- Science in Personal and Social Perspectives
CONTENT STANDARD F:
As a result of activities in grades
5-8, all students should develop understanding of
- Populations, resources, and environments
- Risks and benefits
- Science and technology in society
|
|
NEW MEXICO CONTENT STANDARDS, BENCHMARKS, & PERFORMANCE STANDARDS
SCIENCE Benchmarks Directly Addressed |
| |
| Strand I |
SCIENTIFIC THINKING AND PRACTICE |
| Standard I |
Understand the processes of scientific investigations and use inquiry and scientific ways of observing, experimenting, predicting, and validating to think critically.
|
| 5-8 Benchmark I |
Use scientific methods to develop questions, design and
conduct experiments using appropriate technologies,
analyze and evaluate results, make predictions,
and communicate findings. |
Grade Performance Standards
|
Grade 5
1. Plan and conduct investigations, including formulating
testable questions, making systematic observations,
developing logical conclusions, and communica-
ting findings.
2. Use appropriate technologies (e.g., calculators,
computers, balances, spring scales, microscopes) to
perform scientific tests and to collect and display data.
3. Use graphic representations (e.g., charts, graphs, tables,
labeled diagrams) to present data and produce
explanations for investigations.
4. Describe how credible scientific investigations use
reproducible elements including single variables, controls,
and appropriate sample sizes to produce valid
scientific results.
5. Communicate the steps and results of a scientific
investigation.
Grade 6
1. Construct appropriate graphs from data and develop
qualitative and quantitative statements about the
relationships between variables being investigated.
2. Examine the reasonableness of data supporting a
proposed scientific explanation.
3. Justify predictions and conclusions based on data.
Grade 7
1. Use a variety of print and web resources to collect
information, inform investigations, and answer a scientific
question or hypothesis.
2. Use models to explain the relationships between
variables being investigated.
Grade 8
1. Evaluate the accuracy and reproducibility of data
and observations.
2. Use a variety of technologies to gather, analyze and
interpret scientific data.
3. Know how to recognize and explain anomalous data.
|
| Strand I |
SCIENTIFIC THINKING AND PRACTICE |
| Standard I |
Understand the processes of scientific investigations and
use inquiry and scientific ways of observing, experimenting,
predicting, and validating to think critically. |
| 5-8 Benchmark III |
Use mathematical ideas, tools, and techniques to understand scientific knowledge.
|
Grade Performance
Standards |
Grade 5
1. Use appropriate units to make precise and varied
measurements.
2. Use mathematical skills to analyze data.
3. Make predictions based on analyses of data,
observations, and explanations.
4. Understand the attributes to be measured in a
scientific investigation and describe the units,
systems, and processes for making
the measurement.
Grade 6
1. Evaluate the usefulness and relevance of data to
an investigation.
2. Use probabilities, patterns, and relationships to
explain data and observations.
Grade 7
1. Understand that the number of data (sample size)
influences the reliability of a prediction.
2. Use mathematical expressions to represent data and
observations collected in scientific investigations.
3. Select and use an appropriate model to examine
a phenomenon.
Grade 8
1. Use mathematical expressions and techniques to
explain data and observations and to communicate
findings (e.g., formulas and equations, significant
figures, graphing, sampling, estimation, mean).
2. Create models to describe phenomena.
|
|
|
| Strand I |
SCIENTIFIC THINKING AND PRACTICE |
| Standard I |
Understand the processes of scientific investigations and use inquiry and
scientific ways of observing, experimenting,predicting, and validating to think critically. |
| 5-8 Benchmark II |
Understand the processes of scientific investigations and how
scientific inquiry results in scientific knowledge. |
Grade Performance Standards |
Grade 5
1. Understand that different kinds of investigations are
used to answer different kinds of questions (e.g.,
observations, data collection, controlled experiments).
2. Understand that scientific conclusions are subject to
peer and public review.
Grade 6
1. Understand that scientific knowledge is continually
reviewed, critiqued, and revised as new data become
available.
2. Understand that scientific investigations use common
processes that include the collection of relevant data
and observations, accurate measurements, the
identification and control of variables, and logical
reasoning to formulate hypotheses and explanations.
3. Understand that not all investigations result in
defensible scientific explanations.
Grade 7
1. Describe how bias can affect scientific
investigation and conclusions.
2. Critique procedures used to investigate a
hypothesis.
3. Analyze and evaluate scientific explanations.
Grade 8
1. Examine alternative explanations for
observations.
2. Describe ways in which science differs from other
ways of knowing and from other bodies of
knowledge (e.g., experimentation, logical
arguments, skepticism).
3. Know that scientific knowledge is built on
questions posed as testable hypotheses, which
are tested until the results are accepted by
peers. |
|
Exxon Valdez - oiled beach at Herring Bay (NOAA.GOV)
|
| Strand II |
CONTENT OF SCIENCE |
Standard II
(Life Science) |
Understand the properties, structures, and processes
of living things and the interdependence of living things
and their environments. |
| 5-8 Benchmark I |
Explain the diverse structures and functions of living
things and the complex relationships between living
things and their environments. |
Grade Performance
Standards |
Grade 5
1. Identify the components of habitats and ecosystems
(producers, consumers, decomposers, predators).
2. Understand how food webs depict relationships
between different organisms.
3. Know that changes in the environment can have
different effects on different organisms (e.g., some
organisms move, some survive, some reproduce,
some die).
4. Describe how human activity impacts the
environment.
Grade 6
1. Understand how organisms interact with their
physical environments to meet their needs (i.e.,
food, water, air) and how the water cycle is
essential to most living systems.
2. Describe how weather and geologic events (e.g.,
volcanoes, earthquakes) affect the function of
living systems.
3. Describe how organisms have adapted to various
environmental conditions.
Grade 7
Populations and Ecosystems
1. Identify the living and nonliving parts of an
ecosystem and describe the relationships
among these components.
2. Explain biomes (i.e., aquatic, desert, rainforest,
grasslands, tundra) and describe the New
Mexico biome.
3. Explain how individuals of species that exist
together interact with their environment to
create an ecosystem (e.g., populations,
communities, niches, habitats, food webs).
4. Explain the conditions and resources needed to
sustain life in specific ecosystems.
5. Describe how the availability of resources and
physical factors limit growth (e.g., quantity of light
and water, range of temperature, composition of
soil) and how the water, carbon, and nitrogen cycles
contribute to the availability of those resources to
support living systems.
Biodiversity
6. Understand how diverse species fill all niches in
an ecosystem.
7. Know how to classify organisms: domain, kingdom,
phylum, class, order, family, genus, species.
Grade 8
1. Describe how matter moves through ecosystems
(e.g., water cycle, carbon cycle).
2. Describe how energy flows through ecosystems
(e.g., sunlight, green plants, food for animals).
3. Explain how a change in the flow of energy can
impact an ecosystem (e.g., the amount of sunlight
available for plant growth, global climate change). |
|
|
|
|
Students measuring their collected oil and entering the data into
their data table.
 |
MATHEMATICS Benchmarks Covered or Directly Addressed
|
| |
| Strand |
DATA ANALYSIS AND PROBABILITY |
| Standard |
Students will understand how to formulate questions, analyze data, and determine probabilities.
|
| 6-8 Benchmark D.1. |
Formulate questions that can be addressed with data and collect, organize, and display relevant data to answer them. |
Grade Performance
Standards |
Grade 6
D.1.1 Use statistical representations to analyze data.
D.1.3 Use mean, median, mode, and range to describe
data.
D.1.5 Solve problems by collecting, organizing, displaying
and interpreting data.
D.1.8 Determine the median for a rational number data set
containing an odd number of data points.
D.1.9 Calculate and explain the median for a whole number
data set containing an even number of data points.
D.1.10 Explain advantages and disadvantages of using
various display formats for a specific data set.
D.1.11 Formulate and solve problems by collecting,
organizing, displaying, and interpreting data.
Grade 7
D.1.1 Describe how data representations influences
interpretation.
D.1.2 Select and use appropriate representation for
presenting collected data and justify the selection.
D.1.3 Use measures of central tendency and spread to
describe a set of data.
D.1.4 Choose between median and mode to describe a set
of data and justify the choice for a particular situation.
D.1.13 Analyze problems by identifying relationships,
distinguishing relevant from irrelevant information,
identifying missing information, and selecting,
collecting, and displaying appropriate data to
address the problem.
Grade 8
D.1.3 Organize, analyze, and display appropriate
quantitative and qualitative data to address specific
questions including:
- plots
- bar, line, and pie graphs
- charts and tables
D.1.4 Select the appropriate measure of central tendency
to describe a set of data for a particular problem
situation.
|
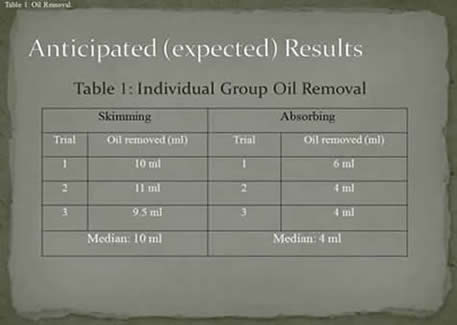
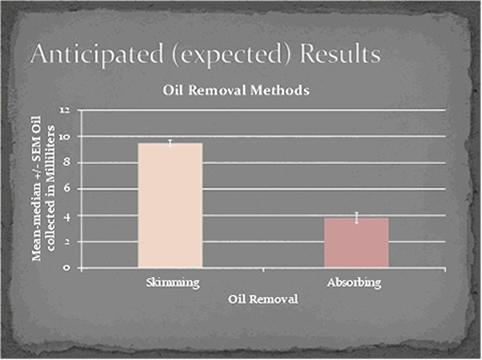
One student group's expected results for comparing the skimming and
absorbing methods for cleaning oil off of the surface of the water.
|
| |
| Strand |
DATA ANALYSIS AND PROBABILITY |
| Standard |
Students will understand how to formulate questions,
analyze data, and determine probabilities. |
| 6-8 Benchmark D.3. |
Develop and evaluate inferences and predictions that are
based on data. |
Grade Performance Standards
|
Grade 6
D.3.1 Identify claims based on statistical data and evaluate
the validity of the claim
D.3.2 Conduct observations, surveys, experiments and/or
simulations, record the results in charts, tables, or
graphs, and use the results to draw conclusions and
make predictions.
D.3.4 Compare expected results with actual results in a
simple experiment
Grade 7
D.3.2 Analyze data to make accurate inferences,
predictions, and to develop
Grade 8
D.3.2 Describe how reader bias, measurement errors,
and display distortion can affect the interpretation
of data, predictions, and inferences based on data.
D.3.3 Conduct simple experiments and/or simulations,
record results in charts, tables, or graphs, and use
the results to draw conclusions and make predictions.
D.3.4 Compare expected results with experimental results
and information used in predictions and inferences. |
|
|
|
| Strand |
DATA ANALYSIS AND PROBABILITY |
| Standard |
Students will understand how to formulate questions, analyze data, and determine probabilities.
|
| 6-8 Benchmark D.2. |
Select and use appropriate statistical methods to
analyze data. |
Grade Performance Standards |
Grade 6
D.2.1 Choose an appropriate graphical format to
organize and represent data.
D.2.2 Describe the effects of missing or incorrect data.
D.2.3 Compute and analyze statistical measurements for
data sets:
- understand how the inclusion or exclusion of
outliers affects measures of central tendency
- know why a specific measure of central
tendency provides the most useful
information in a given context
D.2.4 Use data samples of a population and describe
the characteristics and limitations of the sample.
D.2.5 Identify different ways of selecting a sample (e.g.,
convenience sampling, responses to a survey,
random sampling) and which method makes a
sample more representative for a population.
D.2.7 Identify data that represent sampling errors and
explain why the sample and the display might
be biased.
D.2.8 Identify claims based on statistical data and, in
sample cases, evaluate the validity and
usefulness of the claims.
Grade 7
D.2.1 Choose and justify appropriate measures of central
tendencies (e.g., mean, median, mode, range) to
describe given or derived data.
D.2.2 Know various ways to display data sets (e.g., stem
and leaf plot, box and whisker plot, scatter plots)
and use these forms to display a single set of data
or to compare two sets of data.
D.2.3 Use the analysis of data to make convincing
arguments.
D.2.5 Use data samples of a population and describe the
characteristics and limitations of the sample.
D.2.6 Identify data that represent sampling errors and
explain why the sample and the display might
be biased.
D.2.7 Identify claims based on statistical data and evaluate
the validity of the claims.
Grade 8
D.2.2 Generate, organize, and interpret real number
and other data in a variety of situations.
D.2.3 Analyze data to make decisions and to develop
convincing arguments from data displayed in a
variety of formats including:
- plots
- distributions
- graphs
- charts & tables
D.2.4 Interpret and analyze data from graphical
representations and draw simple conclusions
D.2.5 Evaluate and defend the reasonableness of
conclusions drawn from data analysis.
D.2.6 Use appropriate central tendency and spread
as a means for effective decision-making in
analyzing data and outliers.
D.2.8 Use appropriate technology to display data as
lists, tables, matrices, graphs, and plots and to
analyze the relationships of variables in the data
displayed.
|
One student group's expected data graph with estimated statistics (standard error) for comparing the skimming and absorbing methods for cleaning oil off of the surface of the water. |
|
| |
|
TEACHER
OBSERVATIONS AND REFLECTIONS |
| |
This RIP scientific inquiry was meant to help my students understand what oil spills do to the ecosystem and how hard it is to clean them up. Within this framework, I expected my students to achieve a number of benchmarks in science and mathematics shown in the national and state standards tables presented above. At the same time, I wanted to stimulate student interest in a topic that would make them want to know more about the science content involved in their inquiry.
From start to finish, this STEM research investigation took about
four weeks. Engaging in this RIP was a rigorous experience
for the students. However, the gains achieved were well
worth it.
It allowed them to see just how disturbing and detrimental oil
spills are, and helped them to understand that oil spills affect
the environment in many ways. It helped them to realize that
cleaning up an oil spill is not an easy process, but actually a
difficult and time-consuming process that involves many hours
and dedication of hard work. They also found out that when
oil does spill and contaminates water; it cannot be cleaned
up 100% and the aftereffects last for years.
The students developed a profound understanding of the
meaning of environmental stewardship and the impact of
humankind on both aquatic and terrestrial ecology. Completing
this STEM oil spill inquiry has helped open their eyes to what was happening in the Gulf of Mexico due to the oil that is leaking
from an underwater wellhead. They had come to realize that
the oil spill in the Gulf might become the worst oil spill that our nation has ever experienced. They recognized what the
oil is doing to the waters and the wildlife of those creatures inhabiting that environment. They are also aware of the great impact this disturbing oil spill will have on people’s livelihoods
all around the nation and maybe even around the world.
Two important outcomes from my implementing this STEM inquiry
into my curriculum were: students began "thinking out of the
box," and the concepts to which my students were exposed
came alive with meaning. The oil industry is and its consequences are found across environments. Every day in this area of our
state, we are exposed to reminders that oil fields and drilling
are not just in the ocean. This, along with the Gulf oil spill
media coverage, really highlighted the relevance of this
STEM scientific investigation.
Incorporation of the RIP education model into my classroom
has allowed my students to be engaged in their learning,
|
|
provided them with a thinking tool to be used to make
decisions, promoted cooperative learning experiences,
fostered in them the ability to think critically, encouraged
and resulted in creativity, and provided them with
opportunities to share their knowledge of concepts with others. All of these activities are incorporated in the Next Generation Science Standards (NGSS) as scientific and engineering practices.
The RIP scientific inquiry model of instruction has had a
positive impact on my approach to teaching by allowing me
to be more creative in introducing and teaching new concepts
to my students. My incorporation of this inquiry-based STEM instructional model has allowed flexibility in my teaching.
As for positive learning behavior outcomes, I observed the
excitement in my students as they learned through this inquiry.
They are excited to come to my classroom and learn when they
are involved in a research investigation. This way of learning
stimulates camaraderie among the students. I have observed
students working well cooperatively with one another. I have
also observed allot of critical thinking happening that led
them to good questions and answers, whereas before my
students would just sit and wait for an answer to be
given to them. I was actually able to observe students making
decisions for themselves in a constructive and positive way.
How wonderful it is to see students questioning and actually researching to find an answer on their own!
The data collection, sharing, and analysis involved in this inquiry
was extensive. Most of this was done by my students in one
45 minute class period at my request. Because this proved
somewhat overwhelming for some of my students, I have
decided to extend the amount of time for them to do this
part in the future.
I feel like I am a more effective teacher of science as a result of participating in the RIP program training and using this type of
student-centered instruction. The RIP program has opened my
eyes to so many new things. By incorporating RIP into my
classroom I feel that my confidence level has risen in teaching,
and my knowledge of the concepts I teach has grown tremendously.
My success at using scientific inquiry to achieve these goals
was largely due to my application of the RIP to my teaching
and the ongoing support provided by ANOVA Science and my
colleague, Ricki Colomb, with whom I attended the RIP training.
|
|
| |
ADDENDUM FROM ANOVA SCIENCE WEBMASTER |
|
| |
Oil spills are a tragedy whenever and wherever they occur because of their impact on our environment and its ecosystems. However, inquiry-based instruction in elementary and secondary education can capture valuable learning opportunities from such catastrophic events that result in positive outcomes. These have immediate impact on student learning and possible future impact on how these students understand and handle environmental stewardship. Equally important, seizing such opportunities to imbed STEM into the classroom learning experience may well lead to motivating students to pursue further education in STEM fields.
Students from this middle school level Featured RIP-Based Inquiry as well as from our previously Featured kindergarten RIP-Based Inquiry were motivated to action by the occurrence of and devastation caused by oil spills. They learned more about these events by applying the four STEM (science, technology, engineering, and mathematics) fields in their investigations. In this seventh grade RIP inquiry, students explored the impact of a simulated oil spill that they made occur in their model oceans with shorelines. They compared two methods (technologies) to determine which would work the best for trying to clean the oil off of the surface of the water. In the kindergarten RIP inquiry, the students compared various methods (technologies) for cleaning up a simulated oil spill and applied what they learned in their research investigation by designing and building their own model technology for cleaning up ocean oil spills. Students are not only learning about the use of models in describing scientific concepts, but also are using models to conduct their own investigations into concepts about the natural world.
The creativity that resulted from student interest in this topic is obvious, as is the fervor in which they tackled a project that involved a high level of rigor in the designing of the investigation, the conducting of the study, and the mathematics involved in the data analysis used to provide the evidence they needed to support their decisions about their hypotheses. And although the investigations were challenging and really made students apply their thinking, they still enjoyed them immensely. Anonymous assessments were given to Ms. Miller’s seventh grade students at the end of the year to determine their attitudes towards learning science through RIP scientific inquiry. At the end of the school year, 97% of Ms. Miller’s students wrote ONLY positive statements
|
|
describing their experiences in learning science that included “fun," "intriguing," "like learning about the earth," "more discoveries to make," "learn new things," and "lots of interesting things to learn.” Compared to 85% at the beginning of the year prior to their learning through scientific inquiry, 91% percent of her students said they would like to learn more science at the end of the year. The students supported their positive attitude towards learning science with reasons for them, such as “I like science because it causes thinking,’ “in science, we can learn how we can help our planet,” “science if cool,” “I would like to learn more because you can do some exciting things,” and “I would want to because it’s fun doing the Research Investigation Process.” It is obvious that Ms. Miller’s students are already achieving the National Science Education Standards (NSES) “Goal I: Experience the richness and excitement of knowing about and understanding the natural world.”
There is much current debate as to whether the ocean is purging itself and the BP oil spill disappearing largely on its own (through microbial feeding and evaporation), or whether the oil is just sitting non-detectably in large and small plumes below the surface of the Gulf’s water, both which may or may not lead to longterm, far reaching consequences on the Gulf’s ecosystems. Regardless of whether or not the oil in the Gulf of Mexico is dissipating or just not being detected, the more background information gathered and understood by the students through their research investigations, the more they are able to achieve “Goal III” of the NSES: “Engage intelligently in public discourse and debate about matters of scientific and technological concern.” Perhaps learning how prevalent oil mishaps are is important enough of a lesson and contribution to the likelihood that the future stewardship of these elementary and secondary students will make a major and lasting impact on the Earth and its ecosystems.
Clearly the students involved in this investigation were deeply involved in using the scientific and engineering practices described in the Next Generation Science Standards (NGSS) as they pursued the answer to their research question.
Note: Technically speaking, the PB oil spill may be best described as an oil "gusher." The oil was not "spilled" into the ocean from a holding source, but was shooting out of the earth naturally and entering the ocean directly from a pipe in a hole that had been drilled into the earth.
|
|
| |
|
© 2017-2023 ANOVA Science Education Corporation. All Rights Reserved. |
|
|
